Recently, the research team from Shanghai Institute of Ceramics, cooperated with the scientists from Shanghai Jiao Tong University and Central South University, made important new progress in the modelling and tuning of critical thermoelectric transport properties. Relevant results have been published in the journal of Nature Communications entitled “Modeling Critical Thermoelectric Transports Driven by Band Broadening and Phonon Softening” (2024, doi:10.1038/s41467-024-45093-6).Critical phenomena are of paramount importance in advancing our understanding of the physical world, providing insights into phase transitions, fostering the discovery of new materials, and enabling the development of innovative technologies. However, experimental and theoretical studies on critical behaviors remain challenging, and the underlying mechanism behind the anomalous thermoelectric properties during critical phase transitions is still elusive. The currently available theoretical models for critical electrical transports are primarily qualitative or focused on a single transport parameter.
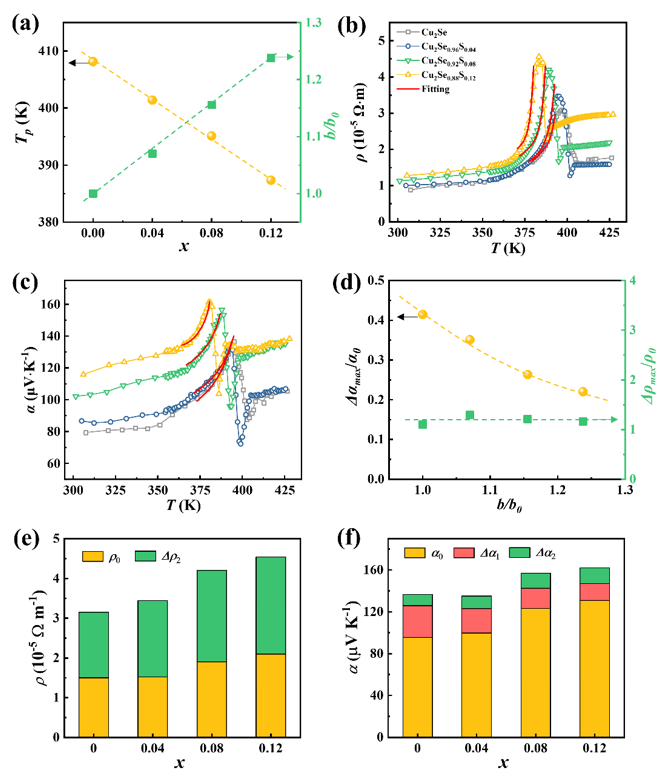
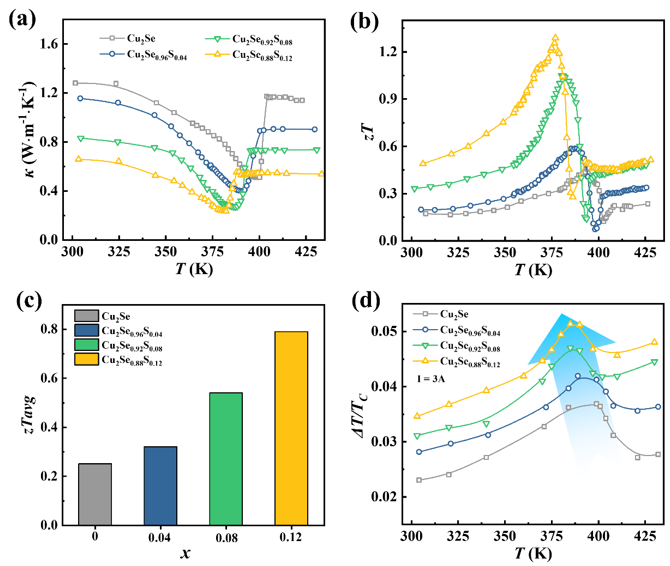
This work developed a quantitative theory to model the entire electrical transports during critical phase transitions by incorporating the band broadening effect and carrier-soft TO phonon interactions. It was found that a small phase transition parameter b leads to a strong band-broadening effect as well as prominent carrier—soft TO phonon interactions. The former contributes an additional term to Seebeck coefficient, while the latter greatly influences both electrical resistivity and Seebeck coefficient. The proposed model was successfully validated using experimental data from Cu2Se and provides valuable guidance for tuning critical transports. Through alloying S in Cu2Se, the features of critical phase transitions were effectively tuned, leading to much enhanced thermoelectric figure of merit zT with a record value of 1.3 at the critical point (377 K), which is at least twice as large as those of normal static phases. This groundbreaking work not only offers valuable insights for future studies on critical thermoelectric transports but also provides inspiration for the exploration of other complex systems such as magnets, fluids, and biological systems.
This work was supported by the National Natural Science Foundation of China and Shanghai Government.
Fig. 1| Band broadening and phonon softening by structural fluctuation during critical second-order phase transitions. (a) Schematic map of structural fluctuation, (b) Free energy Φ as a function of order parameter ξ for different b or temperatures. Schematic maps of (c) band broadening and (d) phonon softening effects. (e) Illustration of the relatively enhanced Seebeck coefficient (Δα/α0) driven by band broadening and phonon softening effects (red indicating large Δα/α0 and purple indicating small Δα/α0, as shown in the scale on the right), with respect to the temperature (T) and phase transition parameter b. (f) The relatively enhanced electrical resistivity (Δρ/ρ0) attributed by carrier-soft TO phonon interaction, with respect to the temperature (T) and phase transition parameter b.

Fig. 2| Tuning the critical electrical transports during phase transitions in Cu2Se1-xSx. (a) Critical temperature Tp and the relative phase transition parameter b/b0 as a function of S content x. b0 denotes the phase transition parameter for Cu2Se. Temperature dependence of (b) electrical resistivity ρ and (b) Seebeck coefficient α. Red lines represent the fitting results by our model. (d) The maximum relative increment of electrical resistivity Δρmax/ρ0 and Seebeck coefficient Δαmax/α0 at Tp as a function of phase transition parameter b/b0. The dashed lines are guide to the eyes. (e, f) The respective contribution of electrical resistivity and Seebeck coefficient from the normal phase (ρ0 and α0), the band broadening effect ( ), and the carrier-soft TO phonon interactions ( and ) at the critical point.

Fig. 3| Thermal conductivity, TE figure of merit zT, and cooling performance. Temperature dependence of (a) thermal conductivity κ and (b) zT values for Cu2Se1-xSx (x = 0, 0.04, 0.08 and 0.12). (c) Average zT from 300 K to the critical point. (d) ΔT/TC vs temperature measured at I = 3A for the TE unicouple made of p-type Cu2Se1-xSx and n-type Yb0.3Co4Sb12. TC is the temperature of the cold junction side. Solid lines are guides to the eyes.

